
Today, everyone is trying to get assets and campaigns out the door as fast as possible. Deadlines dictate our strategy and deliverables are pushed through the pipeline without stepping back to ask if we’re actually really being efficient.
Ironically enough, as much as digital creators emphasize the importance of KPIs to our clients, most of us aren’t doing it for ourselves. So our processes never change to fill the gaps or address the countless revisions that could have been avoided.
To us, that makes no sense. How can we preach the importance of analytics in continuous improvement when we’re completely ignoring them ourselves?
Well, we don’t have that problem. Because we do measure. Every single project, every single client, every single day.
Seriously. If it sounds like a ton of work, it’s because it is. But it’s worth it because the value it helps us deliver is the most important thing. So we wanted to give you a sneak peek into what our KPI tracking looks like, and how it helps hold us accountable for our clients through improved processes and exceptional results. Let’s dive in.
Why Metrics Matter in Creative Production
We get it, most studios don’t care about metrics. As long as they're getting projects out the door and getting paid for it, they’re less concerned about how that happens. But with that mentality, something’s gotta give — whether it's someone’s time or budget spent on revisions, the quality of the finished product, or the overall happiness of the client.
We aren’t ok with sacrificing any of those things. So we measure everything.
Our philosophy: "What we don’t measure, we can’t control; what we can’t control, we can’t improve."
There’s a unique challenge of balancing creativity with measurable quality is not something most agencies or studios want to draw attention to. But we’re publishing it publicly for you all to see. It’s a level of attention to detail and care that we’re proud of because we know our clients appreciate the better results it delivers.
The Milestones That Drive Us: Our Key Internal KPIs:
Production
For every production or development-based project, we look at three main things. The first two are focused on first-time quality, once for our production and development output, then once for our quality assurance. The third is whether we’re hitting our overall deadlines. Measuring and controlling the first two KPIs, makes it possible to keep the third at 100% (and spoiler alert: we have!).
Here’s what that looks like:
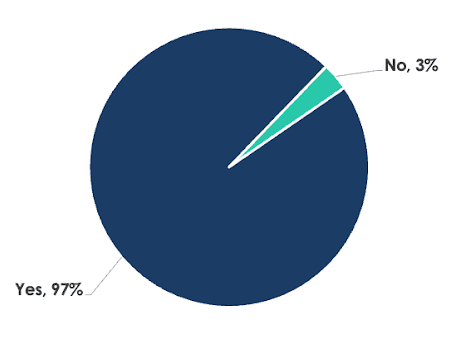
- First-Time Quality (Production/Development): This is where it all starts. After kick off with the client, we have the scope of the project and whoever is assigned to the project starts designing/coding/building. If we get the deliverable to our QA team with no errors or discrepancies with the scope of the project, we’ve earned a “yes” metric.
What would qualify as a “no?” Anything from a text typo to an incorrect kilobyte weight to a video that runs too long. If QA has to catch it, it’s getting reported.
Assemble’s First-Time Quality (Prod/Dev):
June - December 2024
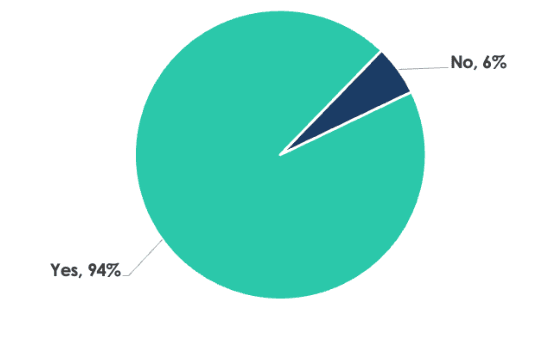
- First-Time Quality of QA (Quality Assurance): With the QA team as our final line of defense, we take this metric very seriously. Because anything that QA misses, the client sees. So while this metric tracks our QA team’s performance, it also signifies how many times a client has to give something back.
What would qualify as a “no?” If a 16-sec video gets through QA and sent to the client for a 15-sec video scope, it gets reported.
Assemble’s First-Time Quality (QA):
June - December 2024
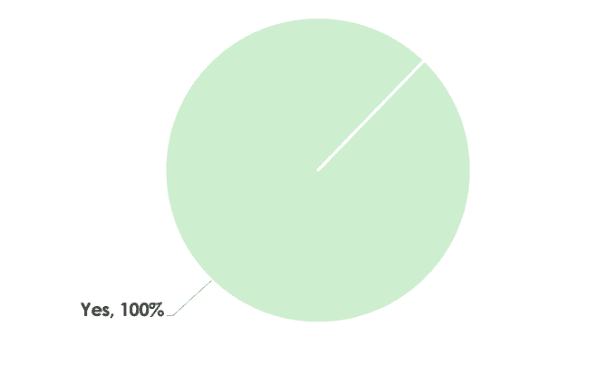
- On-Time Delivery: This one is pretty self-explanatory. The goal here is to meet every deadline without compromising quality.
What would qualify as a “no?” We have to push the initial timeline for any reason, other than the client’s request. (but we haven’t had to worry about that one since we put in the effort on the first two 🙂)
Assemble’s On-Time Delivery:
June - December 2024
Creative
We follow a similar process of measurement for our creative team. In this case, we track our ability to make it through QA without technical errors, number of revisions required, and whether or not we hit our deadlines.
Here’s what that looks like:
- Timeline Adherence: Did we hit OUR targeted project timeline or not? This assumes that everything remains true to the scope and is not modified on the client side.
What would qualify as a “no?” Same as above.
- Technical QA Success: This is where we ensure every asset meets technical and functional requirements.
What would qualify as a “no?” Let’s say we use the wrong color format for print or the incorrect specs for a specific platform — anything that doesn’t make it through QA.
Assemble’s Technical QA and Timelines Adherence:
June - December 2024
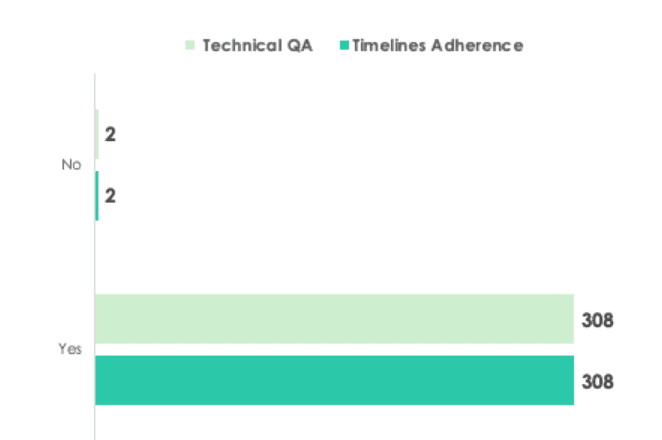
You’ll notice it’s only when an asset doesn’t make it through QA that we ever have a timeline issue. Our team prides ourselves on never missing a deadline for lack of effort.
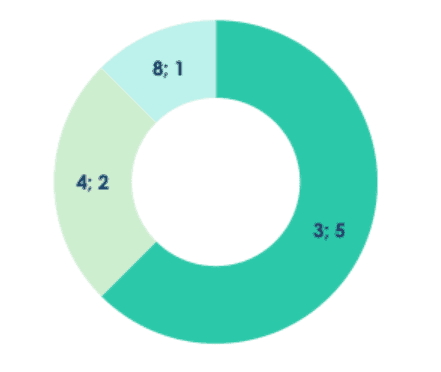
- Revision Rates: Every time a deliverable requires a revision that is based on error, we track it. Revisions get grouped by how many rounds are necessary.
The chart below shows how we group these revisions. In the past six months, we’ve had 5 projects requiring 3 revisions, 2 projects requiring 4 revisions, and 1 project requiring 8 revisions. The remaining projects required no revisions based on error; any revisions that were made were due to client preference.
Assemble’s Revision Rate (> = 3 rounds):
June - December 2024
Our benchmark for “healthy numbers” is our guiding light. We’re adamant on never dipping below 90% success on any metric. Because if we are, we’re not delivering on our process. Luckily, that hasn’t been the case.
Diving into the Details: Reporting for Continuous Improvement
There’s a reason we do all this tracking. (If there wasn't, we wouldn't spend all the unbillable hours doing it!) And that’s to drive purposeful change in our process.
So our measurements get even more granular through filters based on team member and month. This allows us to track individual performance, understanding which of our internal resources is best for which projects, areas they can improve, and how we can avoid potential bottlenecks in the future.
It also helps us discover patterns. Are there certain missing pieces in the clients’ scopes that are causing missed targets or extra revisions? If so, we know better what to ask for from the get-go, helping us refine our own process and make it smoother for everyone involved.
We’re Not Stopping There: Expanding Our Metrics in 2025
Even though we’ve already differentiated ourselves from other studios who fail or refuse to track their own performance, it hasn’t made us complacent. Just like with every aspect of our work, the goal is continuous improvement. So in this year, we’re expanding our metric categories and organization even further to include specific clients, tasks, and deliverables. With this data, we’ll be even more specifically able to assign resources based on specific strengths and capabilities, while also allocating more effort and time into building out the areas in which we’re falling short.
We also hope to incorporate specific client KPIs in a way that ensures our performance is directly supporting the unique goals of each client on a much more granular level. With every addition, our vision is to have the most insightful data to expedite and enhance our process, improve the client experience, and make every outcome more impactful.
Want to learn more about what we’re doing behind the scenes to ensure your experience is top-notch from concept to outcome? Contact us today to chat. We’d love to hear your goals and discuss how we can make that happen for you.